Where do we spend our health care dollars? A paper by Conway et al. in Health Services Research examines this question using data from the Medical Expenditure Panel Survey (MEPS) from 2007. Typically, statistics break down health expenditures by payer (e.g., Medicare, Medicaid, private insurance) or setting (e.g., inpatient, outpatient, nursing home). “However, this is not how patients experience care. Patients have a chronic disease, pregnancy, trauma, or some other life event.”
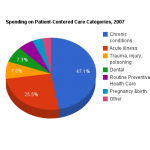
Instead, Conway and co-authors use a “patient-centered” hierarchy to organize health care costs. The chart below gives a breakdown of costs into Conway’s 7 patient-centered categories.
It is clear that chronic conditions make up the greatest share of health spending. This finding is especially true for older individuals. In fact, fifty one percent of health spending for Americans aged 45-64 goes to treat chronic conditions and for seniors 65 and older, this figure rises to 56 percent.
Source:
- Conway, P., Goodrich, K., Machlin, S., Sasse, B. and Cohen, J. , Patient-Centered Care Categorization of U.S. Health Care Expenditures. Health Services Research, no. doi: 10.1111/j.1475-6773.2010.01212.x

This article is featured in the March 3rd edition of the Health Wonk Review. Thanks for your submission!
http://lucidicus.org/editorials.php?nav=20110303a
Great information! In my blog I touch on the economics and changes in healthcare, and it’s good to see another source of information. I subscribed! 🙂