My former colleague Devin Incerti has a nice summary of how to implement survival function estimation in R. Not only does he mathematically describe the probability density function (PDF), cumulative density function (CDF), and hazard rates for 8 commonly used parametric survival curves [see table below], he also describes how to implement these using the stats and flexsurv packages in R (see here) and has built a Shiny app (see here) to help explore these different curves.
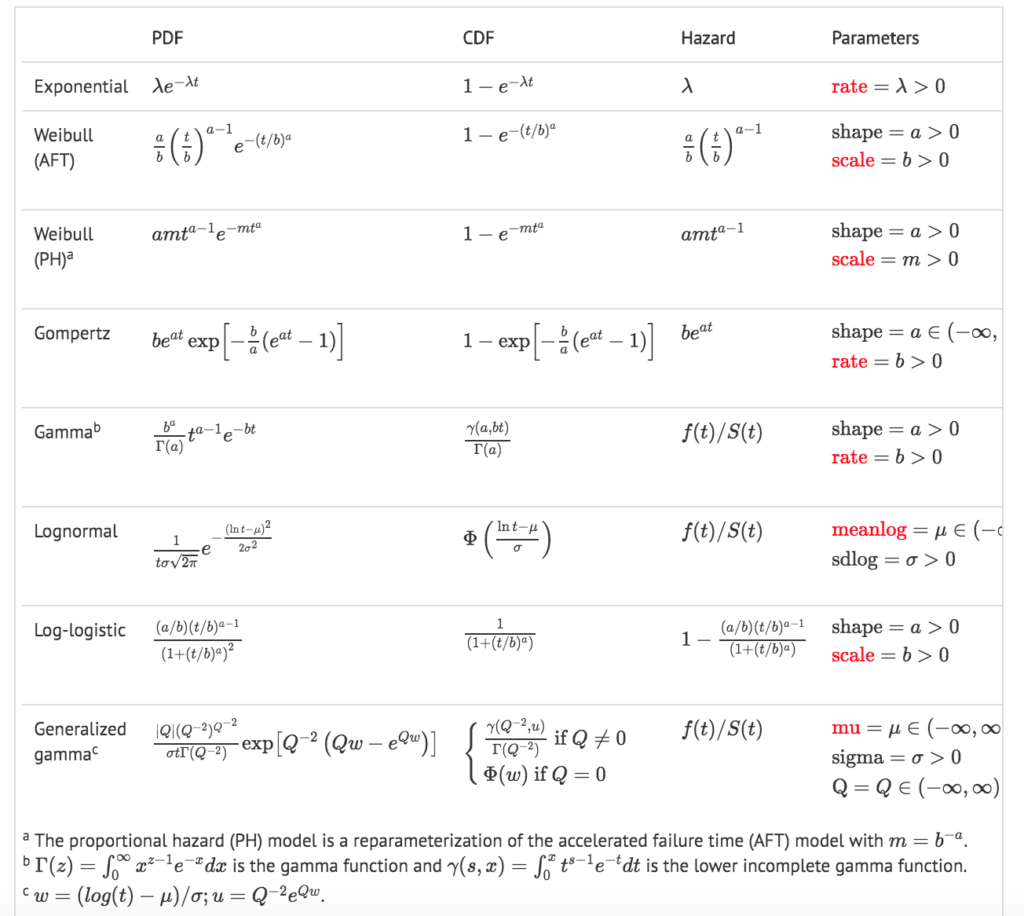
Which model should you use? Well, if you have limited data, the exponential is the simplest to estiamte as it requires only one parameter. Further, it assumes a constant hazard ratio, which may not be a bad assumption if you have limited amount of follow-up time. In other cases, assuming a constant hazard may be unrealistic. Some things to take into account for these distributions.
- Exponential distribution only supports a constant hazard;
- Weibull, Gompertz, and gamma distributions support monotonically increasing and decreasing hazards;
- Log-logistic and lognormal distributions support arc-shaped and monotonically decreasing hazards; and
- Generalized gamma distribution supports an arc-shaped, bathtub-shaped, monotonically increasing, and monotonically decreasing hazards.
After you pick a model, it can be fit to your data using maximum likelihood estimation. Each parameter can be modeled either to fit the data on average, or also as a function of individual covariates. While describing these models is helpful, there are other parametric distributions that cold be considered including splines and fractional polynomials
1 Comment