Healthcare database studies can be complicated. The data itself can be complex. Raw data needs to be transformed into useful variables. Then this analytic file needs to evaluated in an appropriate manner. Plus, the results need to be communicated clearly. What are the key aspects for describing this approach both among members of the research team and to external stakeholders (e.g., journal reviewers and editors).
A paper by Wang et al. (2017) provides a nice overview of the components that go into a high-quality database study.
- Reporting on data source: Researchers should (i) list the data source name, (ii) state the data extraction date, (iii) state the source data search/extraction criteria, (iv) date range of data, (v) type of data (i.e., EHR, claims, survey), (vi) any data linkage, (vii) data cleaning (e.g., approach to addressing missing values),
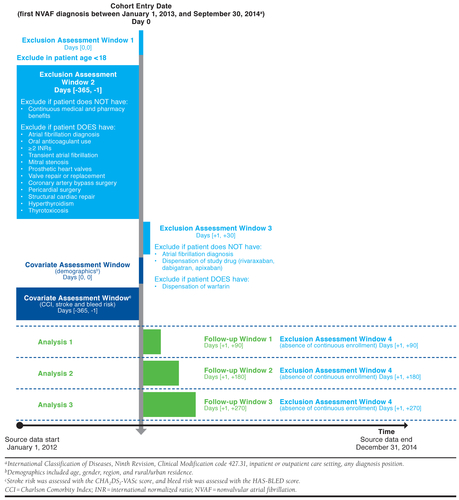
- Design diagram. The authors recommend a design diagram which contains contains 1st and 2nd order temporal anchors and depicts their relation to each other (see example below from [Happe et al. (2020)]
- Inclusion/Exclusion criteria. Researchers should include: (i) dates subjects enter the cohort a.k.a. study entry date (SED), (ii) unit of observations (i.e., person-level, person-time level, episode based), (iii) sequencing of exclusion criteria, (iv) time window over which inclusion/exclusion criteria are applied, (v) the exact diagnosis, procedure, pharmacy codes used for the inclusion/exclusion criteria (vi) number of codes required (e.g., 1 inpatient or 2 outpatient diagnosis codes) (vii) diagnosis code position (i.e., primary vs. secondary vs. any), (viii) enrollment or observations window (i.e., The time window prior to SED in which an individual was required to be contributing to the data source), (ix) washout for exposure (i.e., for new treatment events), and (x) washout for outcome (if want to limit sample to new cases).
- Reporting on exposure definition. Researchers should define: (i) the type of exposure (e.g., drug, procedure, health policy), (ii) whether changes in therapy represent a treatment switch or augmentation, (iii) specific exposure codes (e.g., NDC codes, J-codes)
- Follow-up time. The follow-up time should consider the time from study entry (i.e., SED) to when follow-up is completed. How censoring is identified and taken into account should be made explicit.
- Outcome definitions. Defining an outcome includes determining the event dates, the relevant codes, and validation of the outcome of interest.
- Covariate definitions. For each covariate, researchers must define: (i) a covariate assessment window over which covariates are captured, (ii) the specific codes that are relevant, and (iii) the number or type of occurences for a covariate to be counted in the study. Optionally, researchers may want to specify an index creation in the case where covariates are combined (e.g., Charlson comorbidity index, Elixhauser comorbidity index).
- Statistical approach. One should describe the regression approach used, or if propensity score matching was used how the matching was applied.
- Reporting on statistical software used. It is best practice for researchers to mention in their documentation and in peer-reviewed journal articles the statistical package used.
While most researchers who work with databases are familiar with all the concepts above, having a detailed checklist is helpful for effectively communicating how analyses were done both within the research team and to external audiences for replicability.
Sources:
- Wang, Shirley V., Sebastian Schneeweiss, Marc L. Berger, Jeffrey Brown, Frank de Vries, Ian Douglas, Joshua J. Gagne et al. “Reporting to improve reproducibility and facilitate validity assessment for healthcare database studies V1. 0.” Value in health 20, no. 8 (2017): 1009-1022.
- Happe, Laura E., Joshua D. Brown, Justin Gatwood, Sebastian Schneeweiss, and Shirley Wang. “Application of a Graphical Depiction of Longitudinal Study Designs to Managed Care Pharmacy Research.” Journal of Managed Care & Specialty Pharmacy 26, no. 3 (2020): 268-274.