In many clinical trials, the outcome of interest may be some form of time to event outcome. This could be time until death, time until hospitalization, or time until some other (typically negative) health event.
One simple way to model this is to use a Cox proportional hazard (a.k.a. exponential) model. The Cox model is one of the most popular in both academic research and for HTA submissions. For the Cox analysis to be valid, however, a few key assumptions must hold. These include: (i) hazard are proportional, (ii) linearity, (iii) additive, and (iv) examination of high-leverage points. Let’s look at each of these in turn.
Test for proportional hazard
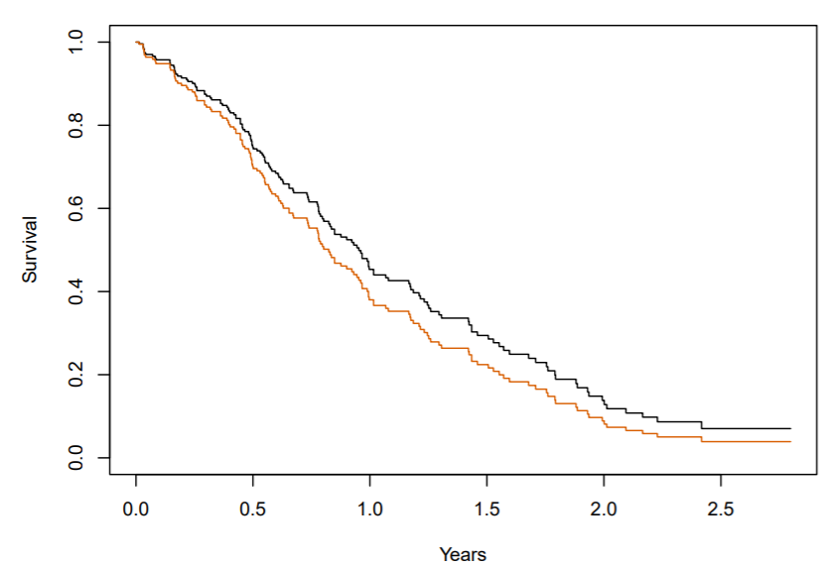
The first step when examining whether the hazard is proportional is to do a visual inspection. One can plot the Kaplan-Meier curves by subgroup and examine whether the hazard appears to create lines with a fairly constant proportional distance.
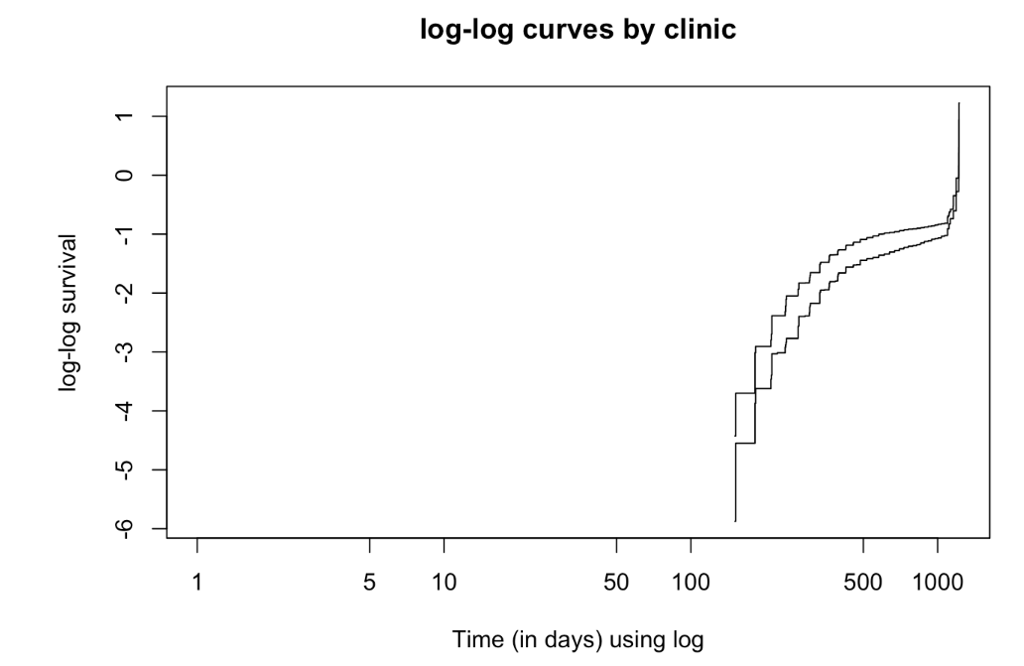
However, this is only a first step. Another approach is to plot the log(-log(survival)) against log(time) graph. If the predictor is proportional, the lines should be parallel.
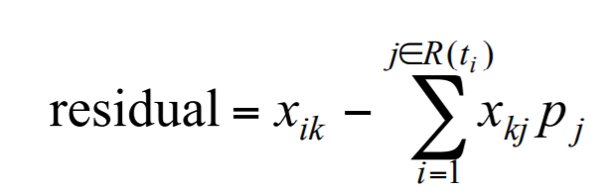
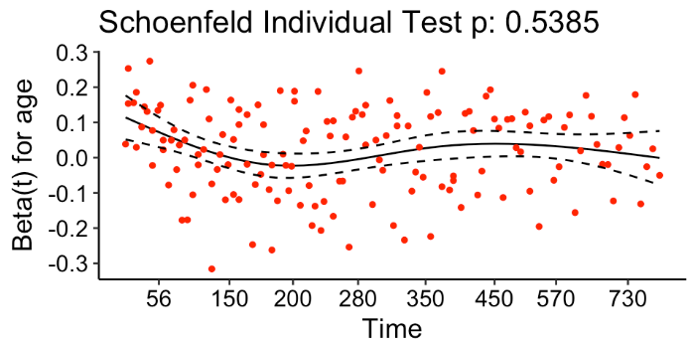
A more formal statistical test for proportional hazards relies on using the Schoenfeld residuals. Rather than estimating a single residual for each individual observation, Schoenfeld (1982) proposed calculating a separate residual for each individual for each covariate. Note that the Schoenfeld residuals are not defined for censored individuals. They are calculated as covariate-value for a given individual who actually died at time t minus the expected value of the covariate for the at risk set at t. The formula is below where xik is the covariate value for covariate k for person i who died at time ti less the probability of that covariate for the people in the at risk group where pj is the probability of dying at time ti. A plot of the residuals is also below. More information can be found here.
Testing for additivity
Testing for additivity is fairly simple and is similar to issues present in any regression model. The standard approach assumes that all variables enter in without interaction. To test for additivity, simple add in interaction terms. For instance, if you have age and gender in your Cox model, include an age-gender interaction term.
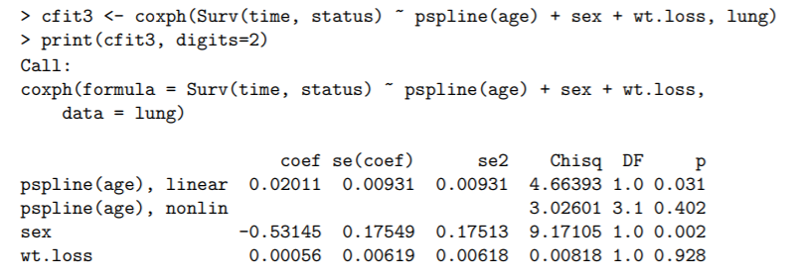
Testing for linearity
Covariates may also enter in a non-linear way. One way to do do this is to include nonlinear terms (e.g., polynomial terms like squares or cubes). One can also include a spline term. One can create a spline term in R using the pspline command. For instance:
Sensitivity to outliers
As in all models, extreme outliers (whether much longer or much shorter survival than average) can have a large influence on the results. Looking into the data and understanding these high-leverage points will be important as they can lead to violation of the three assumptions described above.
In summary
Proportional hazard models are a simple, clear method for conducting survival analysis. To be confident in the results of your model, however, testing for proportional hazards, linearity, additivity and identification of high-leverage outlier points are all needed to help validate the findings from your model.