I have written previously about the need for distributional cost-effectiveness analysis (DCEA) which would increase the value of treatments who improve the health for individuals who currently have the worst expected quality-adjusted life expectancy (QALE). I’ve written about this in AJMC and Health Affairs among other places. One key question many individuals may have is how to actually implement DCEA.
One way to do so is to follow the Love-Koh et al. (2019) approach. There are six key steps to this approach.
- Define the relevant groups of interest
- Measure disease prevalence by group
- Measure impact of the technology
- Identify preferences for equity vs. efficiency
- Calculate the equally-distributed equivalent QALY gains
- Use EDE QALY to do standard CEA modelling.
The first step is to define your groups. This could be by geography, age, socioeconomic status, etc. Defining the group is analytically simple, but can be a challenge as there is no “right” group subdivision. Further, the groupings must have available data.
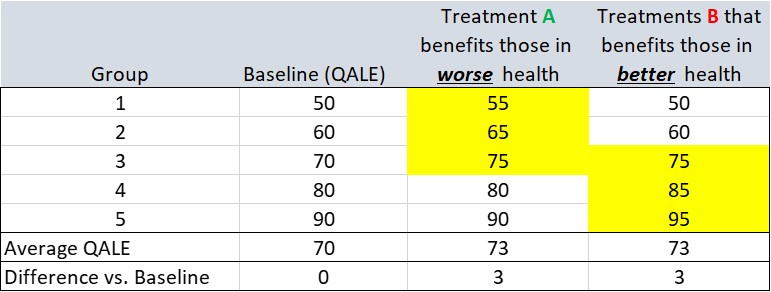
The second step is to measure the prevalence (or incidence of the disease) and the third step is to measure treatment effectiveness. In the example below, treatment A improves the QALE for groups 1, 2 and 3 which are relatively disadvantaged; treatment B improves QALE for groups 3, 4 and 5 who are relatively advantaged (from a QALE standpoint). In this example, it could be the case that the disease that Treatment A impacts only affects groups 1, 2, and 3 (and B affects only 3, 4 and 5) or it could be the case that the disease affects all individuals but the treatment only works for groups 1, 2 and 3 (or 3, 4 and 5 for treatment B). Clearly, treatment A improves health outcomes for the relatively disadvantaged and treatment B improves health outcomes for the relatively advantaged.
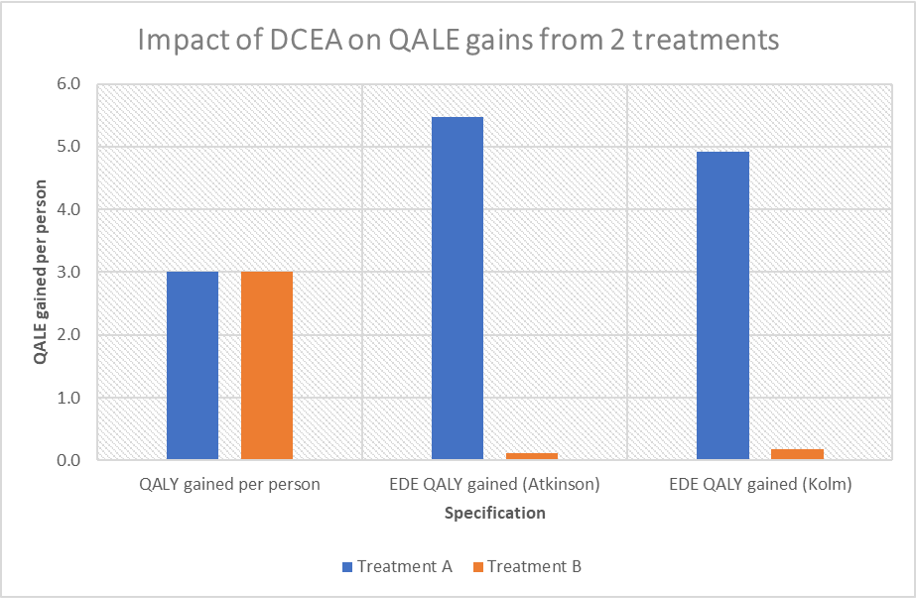
A key question then, is how do you calculate the cost-per-QALY under the DCEA approach? To answer that question, you need to complete steps 4, 5 and 6 above. I do so using based on preferences for relative inequality aversion (an Atkinson index) or an absolute inequality aversion (with a Kolm index). You can find the sample calculation workbook HERE.
The results from this simple example are shown in the graphics below under assumption that the relevant inequality aversion parameter for the Atkinson index is 10.95 and for the Kolm index is 0.15. You can, however, download the spreadsheet and try out how different inequality aversion parameters would impact the results.