A paper by Holmberg et al. (2022) in JAMA provides a number of examples of how collider bias can lead to problematic causal inference. The term collider bias is often invoked when using directed acyclic graphs (DAGs) to map the causal pathway. Collider bias occurs when you aim to measure the impact of A on B by controlling for C, but it is the case that A and B both have a causal impact on C. By controlling for C in your regression analysis, you may create a spurious negative relationship between A and B. This is also known as Berkson’s paradox.
Consider the case where we conducted a study examining whether individuals who attend class get good grades. In the data below, 62.5% of students who attend class get good grades, whereas only 37.5% of students who did not attend class got good grades.
| Attendance | % Getting good grades | Good grades | Bad grades |
| Attends class | 62.5% | 20 | 12 |
| Does not attend class | 37.5% | 12 | 20 |
As a researcher, however, you do not know these value; you need to estimate them. Consider the case where you did a survey of people regarding whether they attended class and what their grades were. A key issue is that indiivudals with good grades and those who attend class are probably more likely to respond to your survey. Consider the following response rates:
- Attends class and good grades: 80%
- Attends class and bad grades: 50%
- Does not attend class and good grades: 50%
- Does not attend class and bad grades: 10%.
In this case, the data we would collect would look as follows:
| Attendance | % Getting good grades | Good grades | Bad grades |
| Attends class | 72.7% | 16 | 6 |
| Does not attend class | 75.0% | 6 | 2 |
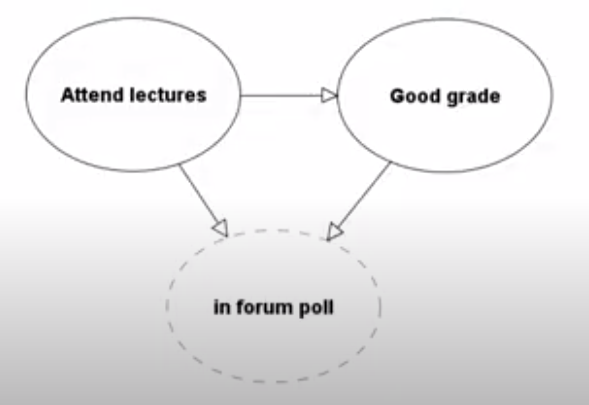
In this example, if we look at the relationship between attendance and grades, it incorrectly appears that not attending class increases the chances of good grades. However, this relationship only exists because survey response rates are both impacted by whether a person gets good grades and whether they attend class. Since both the intervention variable and the outcome impact a third-factor (response rates) this is collider bias. Because we exclude people who respond to the survey (since we don’t have any other choice if we don’t have the data), this leads to a collider bias. The DAG for this causal pathway is below and you can find the math behind the example above in the spreadsheet here.
In fact there is a full video on how to address collider bias. The video also explains why some people believe (incorrectly) that attractive individuals are more likely to be mean.