Recently the CBO published a report compared the rates public and private insurers pay to hospitals for inpatient services, for services at hospital outpatient departments (HOPD), and at ambulatory surgical centers (ASC). A recent RAND report aims to do a similar exercise but contributes to the literature by using updated data from more states, allowing for comparisons between HOPD and ASC. These data come from health insurance claims data form three sources:
- state-based all-payer claims databases from Arkansas, Delaware, Colorado, Connecticut, Maine, New Hampshire, Oregon, Rhode Island, Utah, Vermont, and Washington
- self-insured employers
- health plans
Note that the sample of self-insured employers and health plans is a convenience, not a representative sample. Also, the all-payer database disproportionately covers States in the Northeast and Northwest. Despite the fact that the sample is not full representative, a key benefit is that the data contained allowed amounts (i.e., amounts actually paid including patient out-of-pocket cost), not hospital charges.
The authors calculate differecnes in prices two ways:
- Standardized prices, meaning the average allowed amount per standardized unit of service, where services are standardized using Medicare’s relative weights
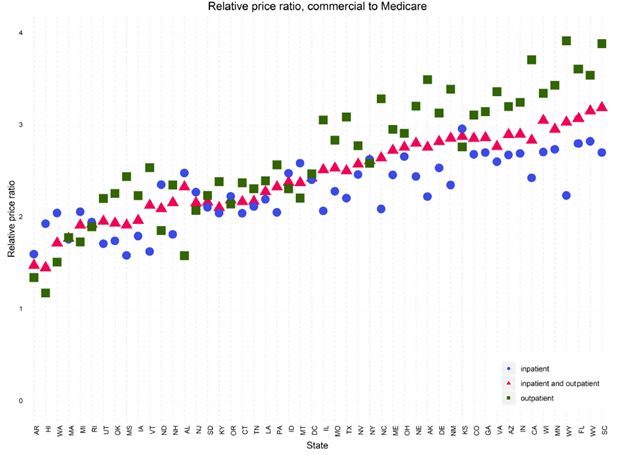
- Relative prices, meaning the ratio of the actual private insurer–allowed amount divided by the Medicare-allowed amount for the same services provided by the same hospital
Relative prices have the advantage of looking at the actual price ratio including Medicare adjustments for case mix, wages, inflation, and medical education; standardized prices allow for comparison of non-Medicare payers to a single nationalized Medicare rate (without adjustments).
Hospital data was also linked to AHRQ’s Compendium of U.S. Health Systems.
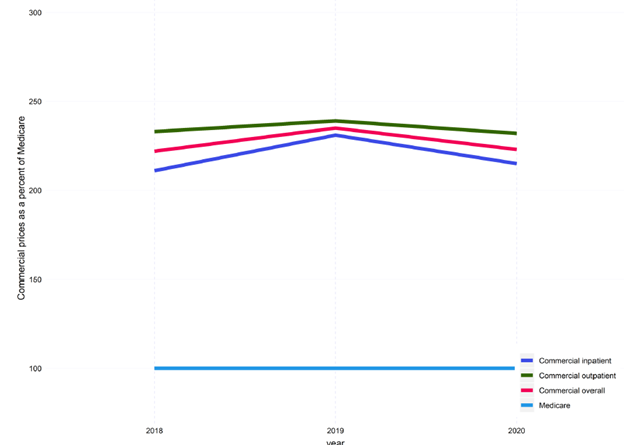
In 2020, when comparing hospital services for commercial vs. Medicare, the average overall relative price was:
- Overall: 224 percent of Medicare prices
- Inpatient services: 217 percent
- Facility payments: 235 percent
- Professional services: 163 percent
The study also examines the relationship between price and quality. There does seem to be a positive correlation between price and quality, but this relationship is fairly weak.
…lower-priced hospitals—those with prices less than 150 percent of Medicare (361 hospitals)—have lower-quality scores than higher-priced hospitals (1,402 hospitals). However, medium-priced hospitals, those between 150 and 250 percent of Medicare (1,409 hospitals), have the highest share of hospitals with five-star ratings. Among high-priced hospitals, 22 percent received five stars and only three percent received one star, whereas among low-priced hospitals, only 14 percent received five stars, while 17 percent of hospitals received one star.
Prices for outpatient surgery was higher for commercial compared to Medicare patients but the ratio is much smaller in magnitude than inpatient services.
- ASC: 162 percent of Medicare cost
- Hospital outpatient (APCs): 117 percent