It seems like everything just gets more and more expensive. But are prices for medical care declining? Cutler et al. (1998) found in seminal paper “Are medical prices declining? Evidence for heart attack treatments” that while unadjusted prices of medical care were in fact rising, quality-adjusted health care costs actually were falling. In my own research, Lakdawalla et al. (2015), I found that while the prices paid for cancer treatments were rising, the quality-adjusted cost of care was flat or even declining. An analogy these quality-adjusted prices would be saying that while the prices for mobile phones have risen over time; accounting for quality (e.g., processing speed, memory) the quality-adjusted prices have fallen dramatically.
A key question then, is how do you calculate a quality-adjusted price index for medical care? A working paper by Dauda, Dunn and Hall (2020)—also published here—aims to answer this question.
One general concept is that when measuring the cost of “medical care”, medical care should be identified as the full medical expenditures to treat an episode of a condition (acute or chronic), rather than the price of an individual service. For instance, the price for treating an acute myocardial infarction (AMI) should be the full price for the treatment rather than changes in the individual inputs used in the AMI; the reason is the composition of these inputs is likely to change over time, particularly in health areas where there is significant innovation.
Dauda, Dunn and Hall (2020) then proposes 4 methods to measure quality-adjusted prices:
Utility-based cost-of-living index (COLI). This approach follows Cutler et al. (1998) and is the authors’ benchmark approach. This method assigns a value to the quality change based on the dollar value of the marginal quality change to a consumer. The formula to calculate this is:
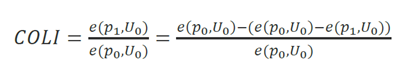
As applied to health, this becomes:
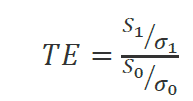
Treatment endpoint (TE) index. This index measures the price per unit of health produced from treatment. In the formula below, this the cost per unit of outcome where σt is measured as the rate of obtaining a successful treatment endpoint. The unit of health could be various clinical treatment endpoints or they could be quality-adjusted life years—as is used in many European countries that use health technology assessment (HTA). This approach the authors note is consistent with the benchmark COLI approach only when there is a linear relationship between the health produced and dollars spent on treatment. This approach assumes that individuals can purchase years of healthy life at a constant average price, yet the authors argue that the marginal quality-adjusted price of medical care is more than the average price because likely there are decreasing returns to health spending (e.g., it’s much easier to get someone to live from 70 to 75 than to move them from 100 to 105). The difference between COLI and TE approach is larger when the marginal utility of health gains is not linear; this is the key assumption from the GRACE model.
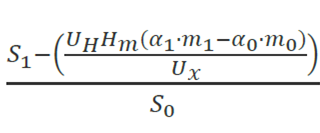
A hedonic index. In a hedonic index, one aims to estimate the relative value of different attributes of a given good or service. If we let g() be the hedonic function for the value of a medical good or service in time period t (mt), the hedonic adjustment in period 1 is g0(m0)-g1(m0), which is the dollar value in spending in period 0 minus the cost of purchasing the period 0 treatment in period 1. The hedonic price index can than be calculated as g1(m0)/S0, which is the cost of purchasing the period 0 treatment in period 1 divided by the spending levels in period 0. The authors note that the hedonic index as an upper bound of the COLI approach. Further that the hedonic index has a number of challenges such as (i) it may not take into account the full utility change, particularly in innovative markets, (ii) methodologies for attribute selection can be challenging and different attribute selection can lead to different results, and (iii) hedonic adjustment may be violated because it is possible that inefficient technologies that do not add to societal welfare may be adopted.
Resource index cost. This index looks at changes in the cost of producing the change in quality. In this framework, the quality adjustment term is based on the opportunity cost (measured in marginal revenue) of devoting additional resources to improving health, rather than producing additional units of the numeraire good.
The authors also test these methods empirically using (i) claims data to study three acute conditions among FFS Medicare patients for the years 2001-2014: acute myocardial infarction (AMI), congestive heart failure (CHF), and pneumonia and data from the Tufts Medical Cost Effectiveness Analysis Registry (CEAR) database.
The summary of their results is as follow:
We find large quality‐adjusted price declines associated with treatment innovations. To incorporate these quality‐adjusted indexes into an aggregate measure of inflation, we combine an unadjusted medical‐care price index, quality‐adjusted price indexes from treatment innovations, and proxies for the diffusion rate of new technologies. In contrast to official statistics that suggest medical care prices increased by 0.53 percent per year relative to economy‐wide inflation from 2000 to 2017, we find that quality‐adjusted medical care prices declined by 1.33 percent per year over the same period.
Thanks to Jeremy Nighohossian, who presented this paper at the monthly CHEP Learning Network meeting. Any errors in the explanation of this paper, however, are my own.