Previously, CMS implemented a Tukey outlier deletion method when calculating Medicare Advantage (MA) and Medicare Part D Prescription Drug Plans (PDP) star rating. A Final Rule implemented in 2022, however, removed the use of Tukey outlier deletion from quality measures. Based on 2020 historical data, 17% of MA plans would have lower star ratings as compared to only 1% would have higher star ratings after removing the Tukey outlier deletion. This begs the question, what is a Tukey Outlier.
Tukey Outlier Definitions.
Tukey outliers are data points that lie outside the following range;
- {Q1 – k(IQR), Q3+k(IQR)}
Here Q1 and Q3 are the first and third quartiles of the data respectively and IQR is the interquartile range (i.e., the difference between the third and first quartile). The term k is a multiplier, which describes how sensitive you would want to be to outliers. John Tukey proposed that k = 1.5 indicates an “outlier”, and k = 3 indicates data that is “far out”.
How likely are you to identify an outlier with the Tukey method?
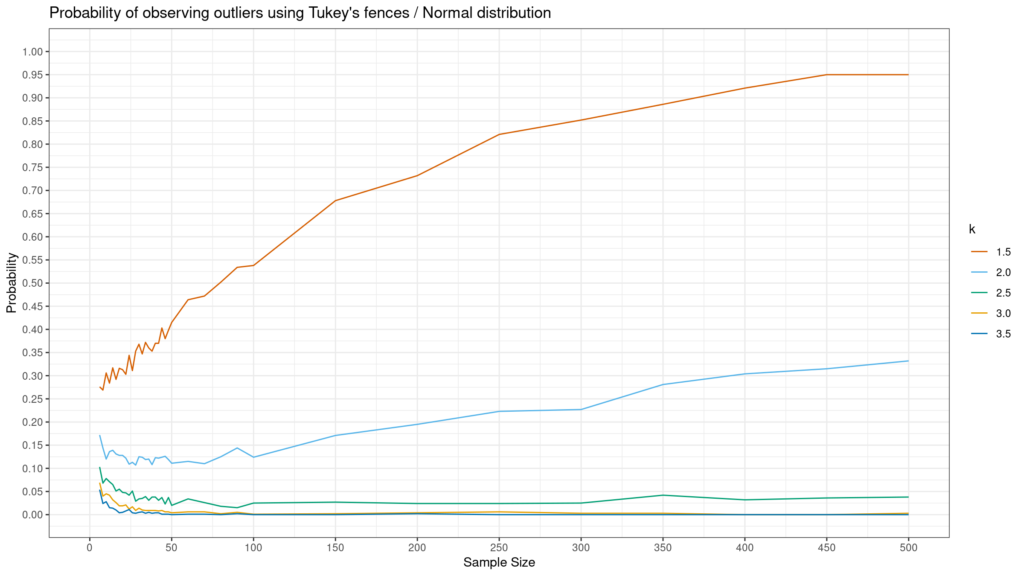
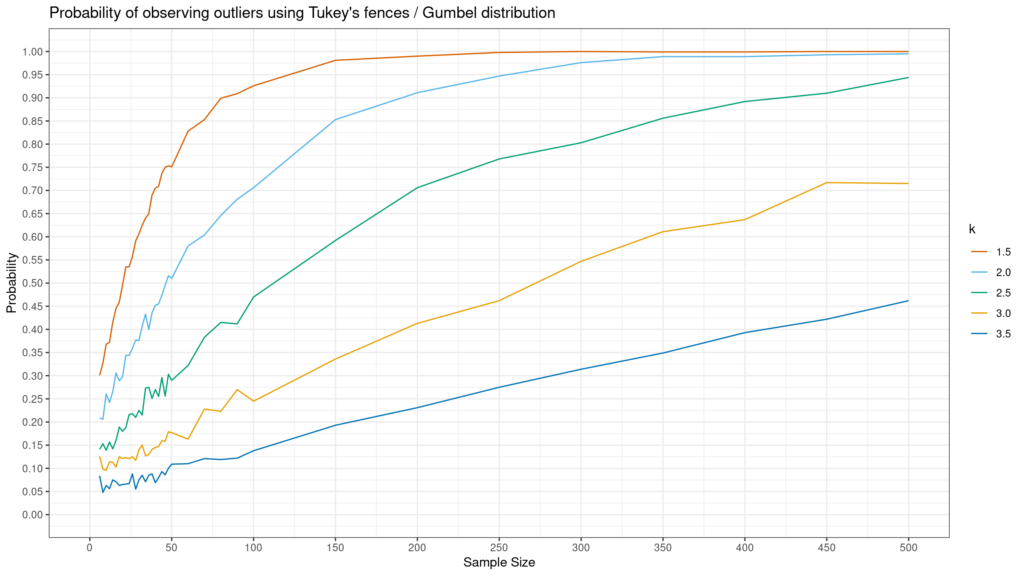
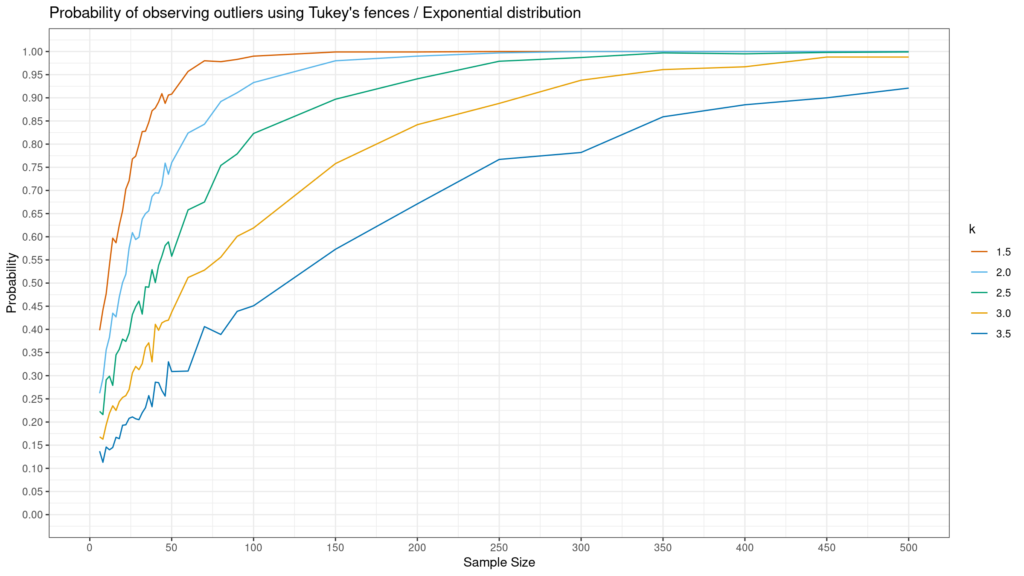
The answer to this question depends on (i) how wide your Tukey range is (i.e., the value of k) and (ii) the shape of your distribution. Andrey Akinshin created simulations to answer this question for Normal, Gumbel and exponential distributions. The results are below. As you can see below, non-normal distributions–especially exponential–are much more likely to have an outlier observed using the Tukey method.


Like all outliers, identification is key but what to do with them depends on context. If these are data errors or pure anomalous situations, one may want to delete them. On the other hand, if these are just outlier values that happen from time-to-time, one should leave them in the data and just try to better understand if there is a data generating process which differs from the regular one which could generate these values. Either way, the Tukey method is a helpful, simple approach for identifying outliers, but it does not tell you what to do with them once they are identified.