A paper by Saulsberry et al. (2023) argues that the Social Vulnerability Metric (SVM) is an improvement over previous social determinants of health (SDOH) measures such as the Social Vulnerability Index (SVI). SVI uses census tract level data to construct overall community rankings based on variables included in four themes:
- “Socioeconomic Status” including percentages below poverty, unemployed, income, no high school diploma;
- “Household Composition & Disability” including proportions aged 65 or older, aged 17 or younger, civilian with a disability, single-parent households;
- “Minority Status & Language” including proportions minority and speaks English “less than well,”
- “Housing Type & Transportation” including proportions multi-unit structures, mobile homes, crowding, no vehicle, and group quarters
I have summarized how SVI could be used as part of a distributional cost effectiveness analysis (DCEA) approach here.
On the other hand, the Social Vulnerability Metric (SVM) proposed by Saulsberry et al. (2023) was constructed using multidimensional Item Response Theory (MIRT), using data from the Agency for Healthcare Research and Quality (AHRQ) SDoH Database. Key differences from SVI.
- Importance rather than equal weighting. SVM was constructing using the MIRT approach (specifically a full-information item bifactor model). As compared to a standard latent variable regression, MIRT allows for multiple latent variable constructs. The the bifactor model specifically “imposes restrictions on the traditional item factor analysis by requiring that each item loads on a primary dimension (e.g., SDoH) and only one subdomain (e.g., physical infrastructure).” The coefficients from the MIRT are used to weight variables in SVM. This approach differs from CDC’s SVI and measures such as the Area Deprivation Index (ADI), which give equal weight to all variables,
- Unit of geography. SVM was based on ZIP code level observations whereas SVI traditionally uses census tract data. However, AHRQ said that the their SDoH data base will be updated to report at the
county, zip code, and census tract block groups in the future (and SVM will be calculated for each of these).
The variables included in SVM span 5 domains.
- Demographic (e.g., age and race/ethnicity),
- Education,
- Economic context (e.g., unemployment rate),
- Physical infrastructure (e.g., housing and transportation),
- Health care (e.g., health insurance coverage).
Note that race/ethnicity is not included in SVM, in part because this way SVM can be used to compare SDoH across race and ethnic groups.
Results
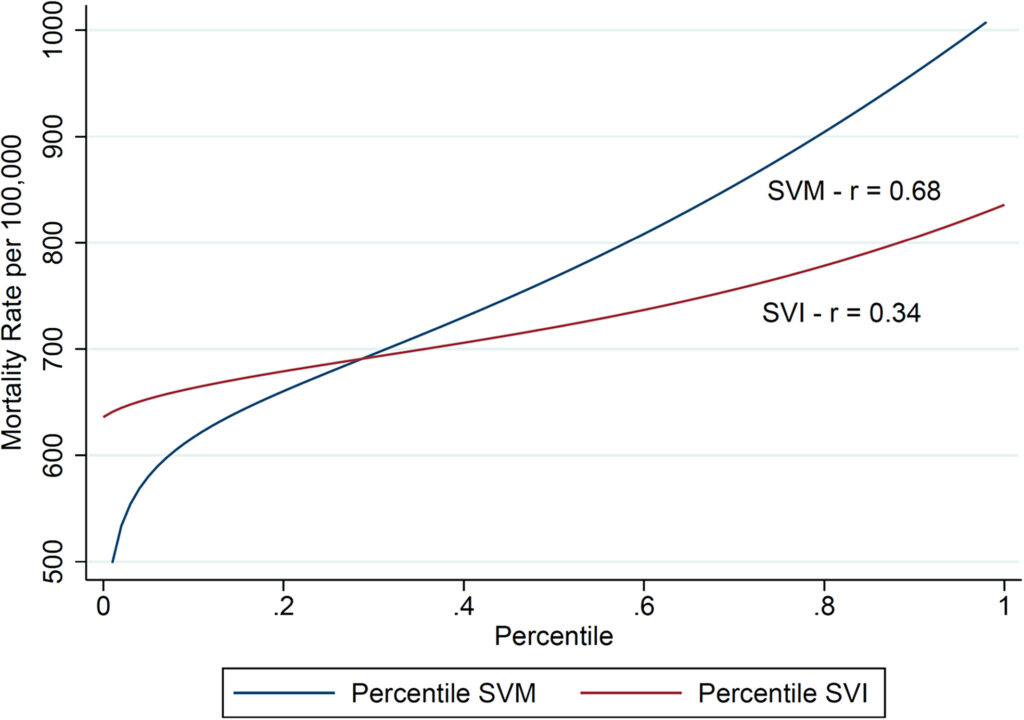
When comparing SVM vs. SVI, SVM did a better job of predicting all-cause, age-adjusted mortality (r=0.68 vs. r=0.34). SVM was also negatively correlated with receipt of one or more COVID-19 vaccinations (r = −0.68) and completion of full vaccination (r = −0.70) and positively correlated with age-adjusted ED visits for asthma for individuals aged 0-18 (r = 0.62) and aged 18 years and older (r = 0.60).
While SVM does appear superior to SVI, it is somewhat more complicated to create given that weights are not equal, and the coefficients in fact span multiple latent variables.
You can read the full article here.