What is the impact of being insured on health outcomes? This is a difficult question to answer in part because of adverse selection (e.g., sicker patients may choose to be insured). But even absent adverse selection, the ability to diagnosis a disease may vary between the insurer and uninsured. Consider this example from Kaliski (2023):
For example, better access to testing improves the rate at which SARS-COV2 infections are detected. If we naively compared the death rate from these infections among insured individuals to that among uninsured individuals, we will be overestimating the effect of access to insurance. This will be because uninsured individuals will have fewer detected cases of SARS-COV2, artificially shrinking the denominator when dividing the number of deaths by the number of cases.
The paper goes on help bound any biases due to differential rates of diagnosis between the insured and uninsured. The authors use a monotonicity assumptions similar to the one used in Manski and Pepper (2000), as long as the direction of any selection bias is known. The two key monotonicity assumptions are:
- Monotone Subgroup Selection. In this context, it means that any given individual is always at least as likely to be diagnosed with a disease if they had insurance compared to if they did not have insurance. Very plausible.
- Monotone Diagnosis Response. This assumption implies that any individual diagnosed with the disease have at least as good outcomes as those who are undiagnosed. This is true as long as physicians are not actively harming patients once diagnosed…again, very plausible.
One implication is that those who are impact of insurance on outcomes is the weighted sum of the impact of insurance on outcomes among those who would always be diagnosed with or without insurance [Xi(1)=Xi(0)=1] and those would only be diagnosed with insurance [Xi(1)=1; Xi(0)=0]. Because insurance may lead to treatment as well as increase the likelihood you are diagnosed, the benefit among the insured is weakly bounded by outcomes among insured individuals who would only be diagnosed if they have insurance. This is described mathematically using the Monotone Diagnosis Response assumption below as:
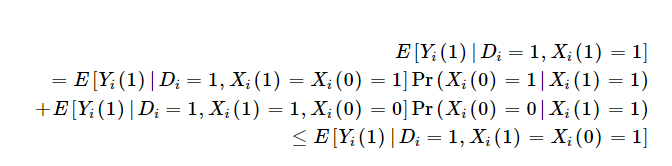
Moreover, if we combine this with the Monotone Subgroup Selection assumption, Kaliski shows that the “diagnosis-constant” subgroup-specific effect of treatment on the treated is at least as large as the sample estimate of the subgroup-specific treatment effect.

Kaliski also notes that if there the data being analyzed has a proxy for average outcomes among the undiagnosed in the control group (i.e., no insurance), but receive a diagnosis in the treated group, then one can identify the diagnosis-constant treatment effect with the assumption that either:
- (i) those who would be in the subgroup of interest regardless of exposure to treatment, or
- (ii) the newly diagnosed, when exposed to the treatment that causes their new diagnosis, are not selected for idiosyncratic time trends.
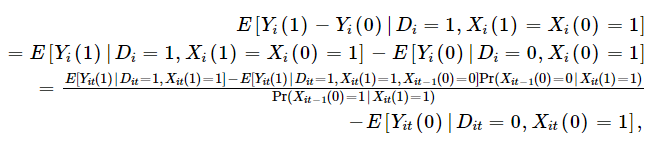
Mathematically this is:

One can then basically, use the likelihood diagnosed people with insurance were not diagnosed before they had insurance to adjust the observed outcomes among the insured. This application requires panel data, but if you have panel data, one can calculate as follows:
Kaliski, then applies this methodology to examine the impact of insurance coverage for insulin treatment for diabetes on outcomes. The exogenous change in likelihood of insurance is–unsurprisingly–the transition to Medicare when people turn 65. Kaliski uses HRS data, which has a panel structure and allows one to examine how diagnosis rates changes before and after transitioning to Medicare either from commercial/Medicaid/other insurance or from no insurance. Using this approach, he finds that:
Using a standard difference-in-discontinuities estimator, and ignoring the effect of new diagnoses, I find a 3% point increase in initiation of insulin use among individuals with diabetes when they turn 65 in 2006–2009 relative to those who turn 65 in 1998–2005. Accounting for the increase in diagnoses of diabetes that occurs at age 65 in 2006–2009 (Geruso & Layton, 2020), I find that the true effect among those who already had been diagnosed before age 65 is likely to be at least as large as the point estimate; exploiting panel data to identify the rate of initiation among the newly diagnosed at age 65, I find that the true effect is 0.6% points larger, 20% larger in relative terms.
In short, just comparing insulin use among insured vs. non-insured was 3%, but in reality the true number should have been 3.6% because not only did Medicare insurance lead to more people who were already diagnosed getting treatment, but also more people were diagnosed with diabetes and thus received treatment.
The full paper can be read here.