Measuring the value of research and development (R&D) is a difficult problem. Specifically, how does one measure the value of R&D on multifactor productivity (MFP). At first glance, one would expect the value of R&D to be proportional to R&D spending in a given year. However, this approach ignores that knowledge from previous years’ R&D spending can effect current productivity levels.
A better approach—one often used in the agricultural economics literature—is to think of R&D as an investment in accumulating knowledge capital or knowledge stocks. A paper by Alston et al (2011) claims that one can measure knowledge stocks as follows.
- KSit=Σk=0L (bk*Rit)
Where L is the total lag length and bk are the parameters that convert (i.e., weight) the R&D spending that occurred k years ago into the knowledge stock. The authors require the weights bk to sum to 1. If the research lag weights bk are distributed according to the gamma distribution, then:
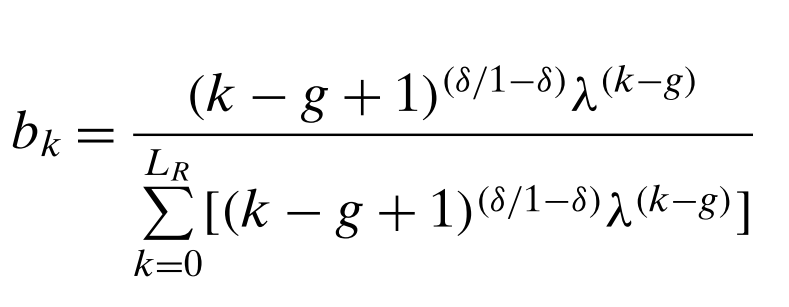
For g≤ k<L; otherwise bk=0.
Here, the term g is the gestation lag before research begins to affect productivity, and δ and λ are parameters that define the shape of the distribution (0 ≤ δ < 1 and 0 ≤ λ < 1). In the case of no gestational lag, we can estimate bk as:
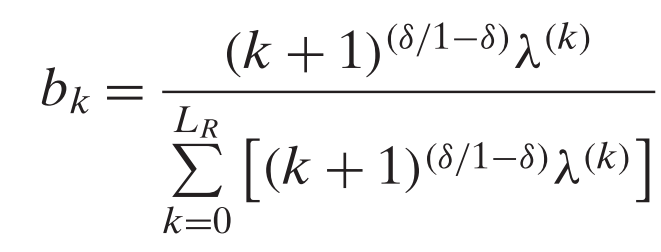
The assumption of no gestational lag may be reasonable for agricultural R&D. For other industries, such as pharmaceuticals, g may be large due to the regulatory burdens of bringing a drug to market.
Once the weights bk are calculated, then we can estimate the knowledge stock in any year and measure the effect of the knowledge stock on productivity as follows:
- MFPit= α0 + α1KSit + α2Xit + eit
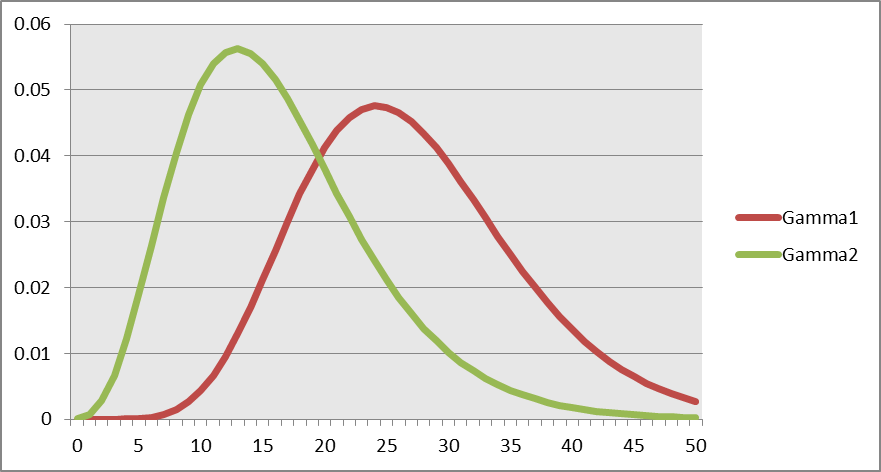
One can choose the parameters δ and λ to maximize the fit of this regression (i.e., minimize the sum of squared errors). This spreadsheet demonstrates how to calculate KS assuming g=0. The figure below shows the distribution of weights bk, for two gamma distributions: the first assuming δ=0.90 and λ=0.70, and the second assuming δ=0.80 and λ=0.75.
Results
The authors use this technique to measure the economic returns to U.S. public agricultural research. The not only use knowledge stocks to measure this value, but also incorporate spillovers between one state’s knowledge stock and another’s. They find the public agricultural research has a real internal rate of return of 9 percent to 10 percent per year.
Source:
- JULIAN M. ALSTON, MATTHEW A. ANDERSEN, JENNIFER S. JAMES, AND PHILIP G. PARDEY. THE ECONOMIC RETURNS TO U.S. PUBLIC AGRICULTURAL RESEARCH. 2011. Amer. J. Agr. Econ. 93(5): 1257–1277; doi: 10.1093/ajae/aar044