Perhaps surprisingly, the answer is PBMs, not drug manufacturers. That is one of the conclusions discussed in a recent commentary by Good and Hernandez (2021). They try to get to the bottom of this question, writing:
Most explanations for increasing drug costs start with drug companies, and indeed they are an easy target. Manufacturers in the US are allowed to set their own price for new products, which are then protected from competition through patent exclusivity…list prices of branded drugs increased at a yearly average of 9.1% from 2007 to 2018…
However, increasing list prices of drugs are partially mediated by ever-increasing discounts. Thus, drug manufacturers point to the net price of drugs (the cost of drugs after all discounts have been applied) rather than the list price as representing a more accurate figure of drug costs…previous analyses indicate that discounts on branded products accounted for 60% the increase in drug costs from 2007 to 2018
More empirical details are provided in a paper by Van Nuys et al. (2021). Using an approach similar to what was used to track flow of funds through the drug distribution system overall (Sood et al. 2017), they find that:
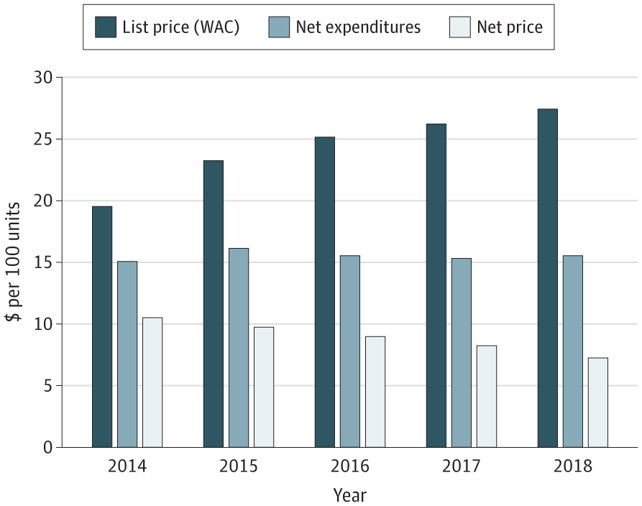
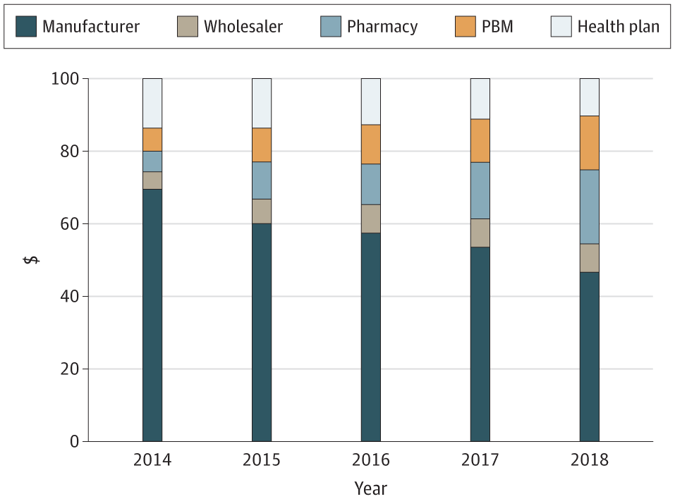
Between 2014 and 2018, mean list prices of 32 insulin products increased by 40.1% (from $19.60 to $27.45), while mean net prices received by manufacturers decreased by 30.8% (from $10.53 to $7.29). Net expenditures per 100 units of insulin increased by 3.2% (from $15.11 to $15.59) while the share of a hypothetical $100 insulin expenditure accruing to manufacturers decreased by 33.0% (from $69.71 to $46.73) and the share accruing to health plans decreased by 24.7% (from $13.82 to $10.40). The share of insulin expenditures retained by pharmacy benefit managers increased by 154.6% (from $5.64 to $14.36), the share retained by pharmacies increased by 228.8% (from $6.21 to $20.42), and the share retained by wholesalers increased by 74.7% (from $4.63 to $8.09).
In short, intermediaries (PBMs, pharmacies) are gaining increasing share of the insulin price relative to drug manufacturers. The graphics below are courtesy of JAMA. Do read the entire paper here.

