What would you prefer:
- Option A: Flip a coin with where if it lands heads you win $20 but if it lands on tails you get $0
- Option B: Win $10 for certain
If you prefer option A, you are risk loving; if you prefer option B you are risk averse. If you are indifferent between these choices you are risk neutral. A key question is, what share of individuals have these preferences and how strong are these preferences. For instance, a risk neutral person may prefer Option B up until the certainty equivalent was $8, then they may switch to Option A. A very risk averse person may prefer Option B until it was lowered to $5, and only then prefer Option A.
One way to measure the strength of these preferences is with a metric known as relative risk aversion.
A paper by Outreville (2014) provides an overview of some papers than aim to estimate relative risk aversion empirically. We find a wide range of RRA estimates.
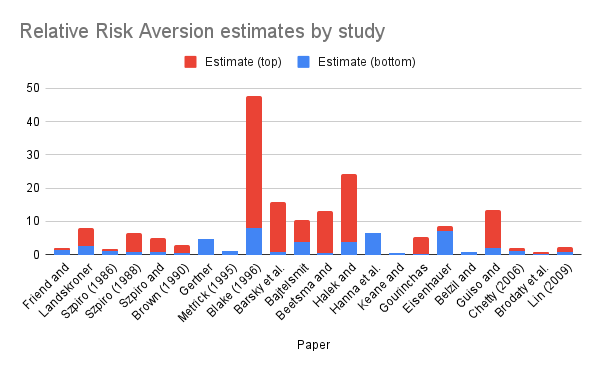
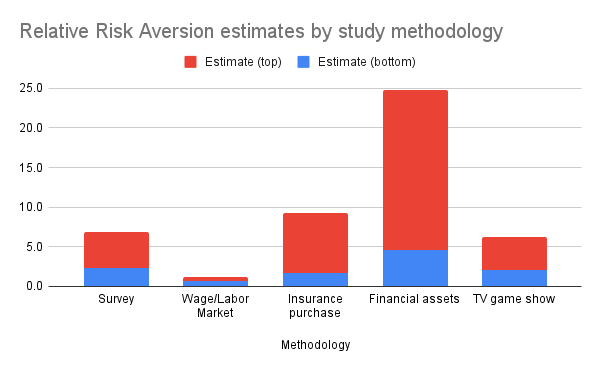
We see that certain methodologies produce higher relative risk aversion estimates than others. Data collected from surveys and game shows produced similar estimates of risk aversion; estimates of relative risk aversion based on financial choices and insurance purchases show much higher levels of risk aversion.
The paper provides additional detail on how relative risk aversion varies across different individual characteristics (e.g., education, wealth, gender) and is worth a read.
- Outreville JF. Risk aversion, risk behavior, and demand for insurance: A survey. Journal of Insurance Issues. 2014 Oct 1:158-86.