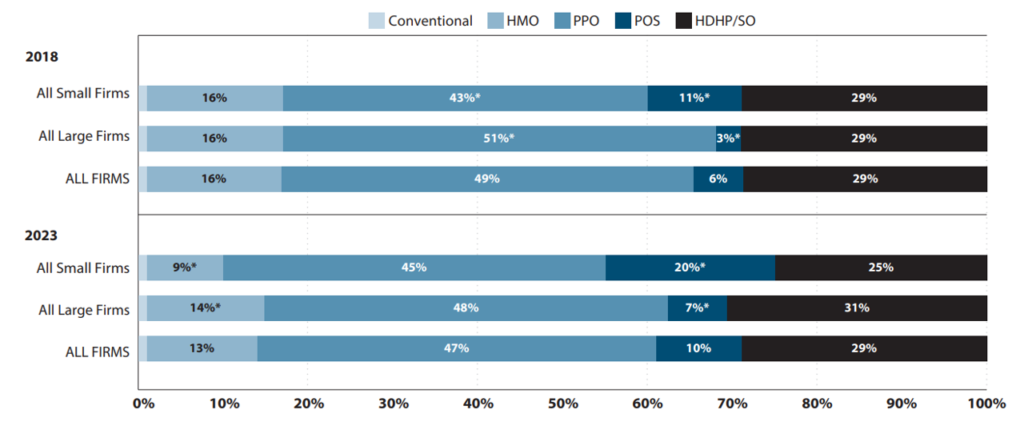
Many researchers are interested in how cost sharing impacts health care utilization, cost and patient outcomes. This is especially true as high-deductible health plans (HDHP) have become more common in the US. In 2023, 29% of covered workers in the US had a HDHP.
One helpful type of data for analyzing HDHPs is claims data. However, there are challenges with using these data:
The first type [of claims data] includes detailed information about plan structure but often has poor externality validity as it is typically sourced from a single health insurer or small subset of enrollees. The second type has improved external validity by pooling across insurers but does not usually include plan-structure variables necessary to distinguish between HDHPs and plans with lower deductibles, or interpret what binary “HDHP” variables represent.
A paper by Cliff et al. (2024) aims to examine how well one can predict plan deductibles using claims data using Optum Labs data. The Optum data do have information on plan deductibles that are used as the “gold standard”. Four different imputation approaches are used:
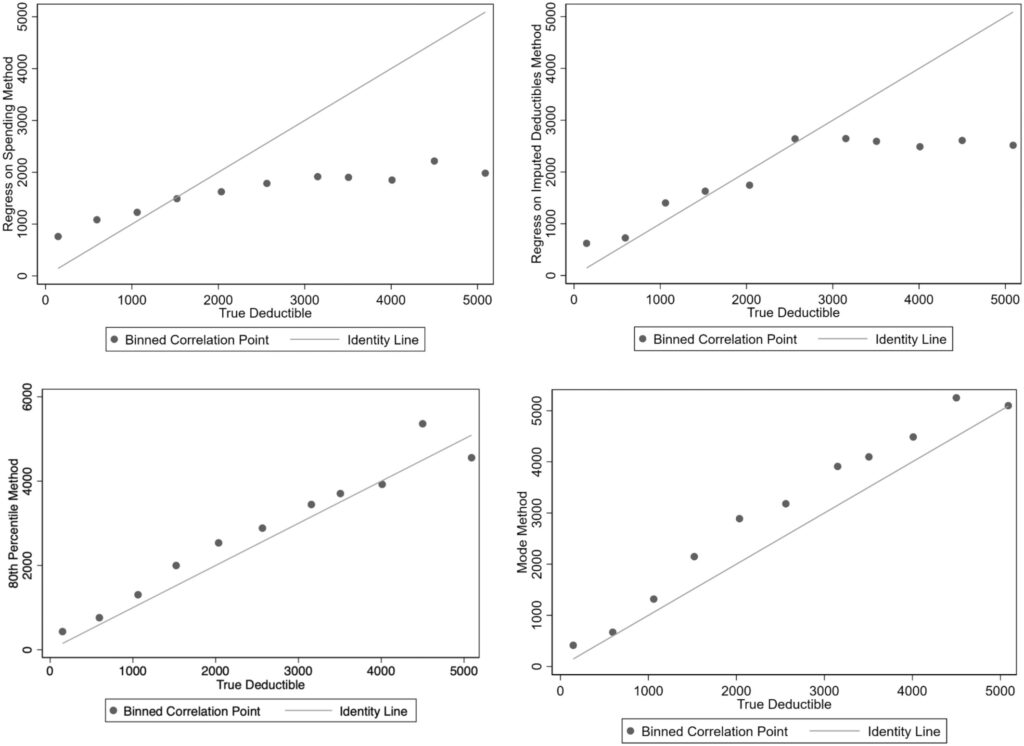
- Parametric prediction with spending (regress on spending method). Enrollee’s annual deductible spending is regressed on their total annual spending (plan plus out-of-pocket), common demographic covariates (gender and age), and fixed effects for each plan Use regression to predict deductibles conditional for set spending level with plan fixed effects. Using the coefficients from the best-fit regression model, deductibles are predicted for each plan at a fixed amount of total spending, (which the authors set at $10,000 to exceed most deductibles).
- Parametric prediction with imputation and plan characteristics (Regress on imputed deductibles method). This approach uses two stages. First, deductibles are inputed for a subset of plans where they are easily identified. For the second stage, a set of covariates is created describing observed deductible spending and plan characteristics and collapse data from the individual to the plan level. Using the subset of plans with an imputed deductible, the imputed deductible amounts are regressed on the set of covariates; generated coefficients are then used to predict deductibles for plans unable to be imputed in the first stage.
- Modal deductible spending (mode method). This simple method inputes the highest (non-zero) modal deductible spending amount among enrollees in a plan and applies this deductible to all enrollees in that plan.
- 80th percentile of deductible spending (80th percentile method). Following Rabideau (2021), individual spending is tracked month-over-month, and individuals where spending increases in a given month but deductible spending does not change are assumed to have reached their deductible. Then, the individual level data is collapsed to the plan level and the deductible for all enrollees in the plan is set to the 80th percentile of annual deductible spending in the plan.
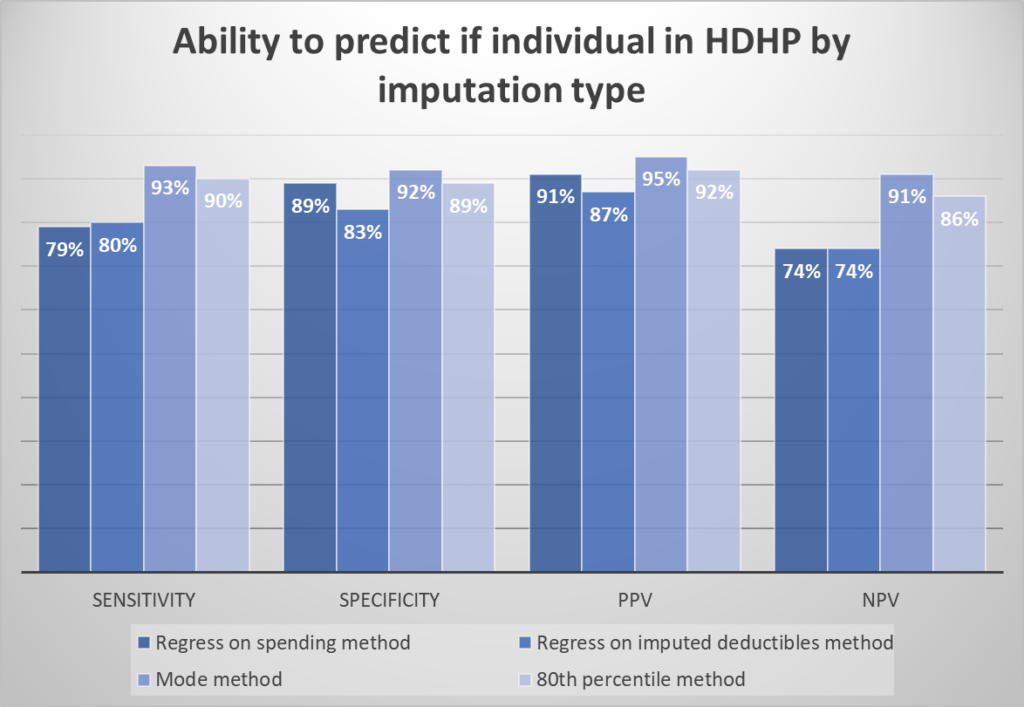
To evaluate the accuracy of the imputation approaches, the authors calculate the sensitivity, specificity, and positive/negative predictive value (PPV/NPV) of each method for classifying enrollees into HDHP vs. non-HDHP plans.
Surprisingly, the simple “mode method” performed best in terms of classifying individuals into HDHP vs. not. It also performed well in terms of predicting deductible spending.
The mode method performs best; 72% of plans are correctly classified into each category and 69% of plans have an imputed deductible within $250 of the actual deductible. For this method, limiting imputation to groups with more than 50 enrollees improved sensitivity to 85% of plans correctly classified by category and reduced the average difference between the imputed and actual deductible from $700 to $496
You can read the full paper here.