How did health care prices change over the past 2 decades. That is the question a paper by Papanicolas (2024) aims to answer, comparing US prices to those from Australia, Canada, France, and the Netherlands between 2000 and 2020.
Before we get to the results, we first need to determine what types of price indices are out there? The authors cite three main types:
- Economy wide price indices: Examples include a GDP price index
- Price indices covering all goods and services consumed by households: Examples include the actual individual consumption (AIC) price index
- National health deflators. These are health-specific prices indices and are produced by a variety of government entities (e.g., in the US Center for Medicare and Medicaid Services (CMS), the Bureau of Economic Analysis (BEA) and the Bureau of Labor Statistics (BLS) all produce national health deflators)
The authors argue that economy-wide and AIC deflators do a poor job for capturing changes in health care prices.
Although they are widely used to deflate health expenditures for international comparisons, the GDP and AIC price indices capture changes in prices overall—not changes in healthcare-specific prices. Given that health care is often provided by non-market producers such as governments (where prices may be imperfect signals of market value), healthcare prices are likely to differ markedly from economy-wide or AIC prices
The data sources the authors used are listed below:
| Country | Name of Index | Producer |
| Australia | Total Health Price Index (THPI) | Australian Institute for Health and Welfare (AIHW) |
| Canada | Total Health Care Implicit Price Index | Statistics Canada |
| France | Price Index for Health | Direction de la recherche, des études de l’évaluation et des statistiques (DRESS) |
| The Netherlands | Price Index for Health | Statistics Netherlands (Centraal Bureau voor de Statistiek, CBS) |
| U.S. | Personal Health Care Price Index | Centers for Medicare and Medicaid Services (CMS) |
Results:
The health care spending growth rate was highest in Australia (5.7%) and the U.S. (4.9%) and lowest for France (2.7%). However, whereas a larger share off the increased spending was due to price increases in U.S. (55% of spending growth), this figure was a big lower for other countries (48%). Further:
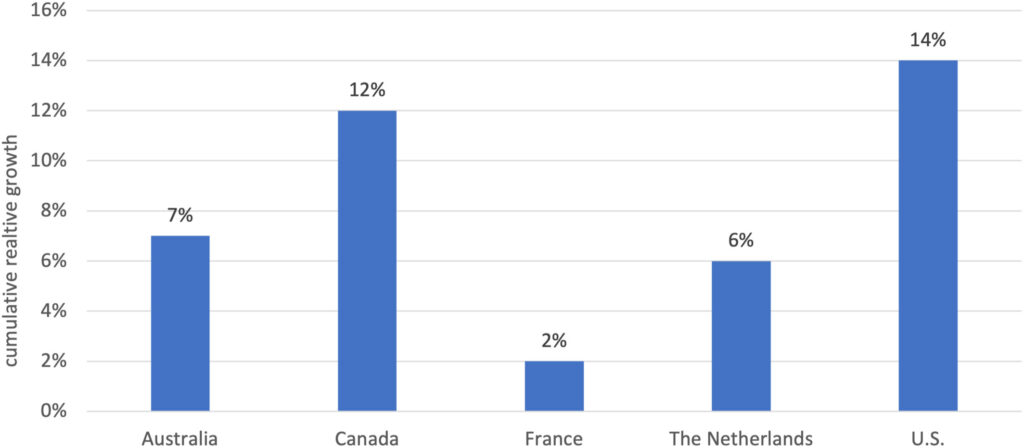
By looking at the ratio of the consumption-based health-specific index to the consumption-based general price index (AIC) over the study period, we find that the United States shows the highest relative cumulative “excess” growth in health prices over the study period (14%), followed by Canada (12%). Australia and the Netherlands also exhibit higher cumulative health price growth over the study period compared to general price growth, although slightly lower (7%–6%) than the first cluster of countries. Finally, France shows the lowest cumulative price growth, with health prices growing only slightly above general prices (2%).
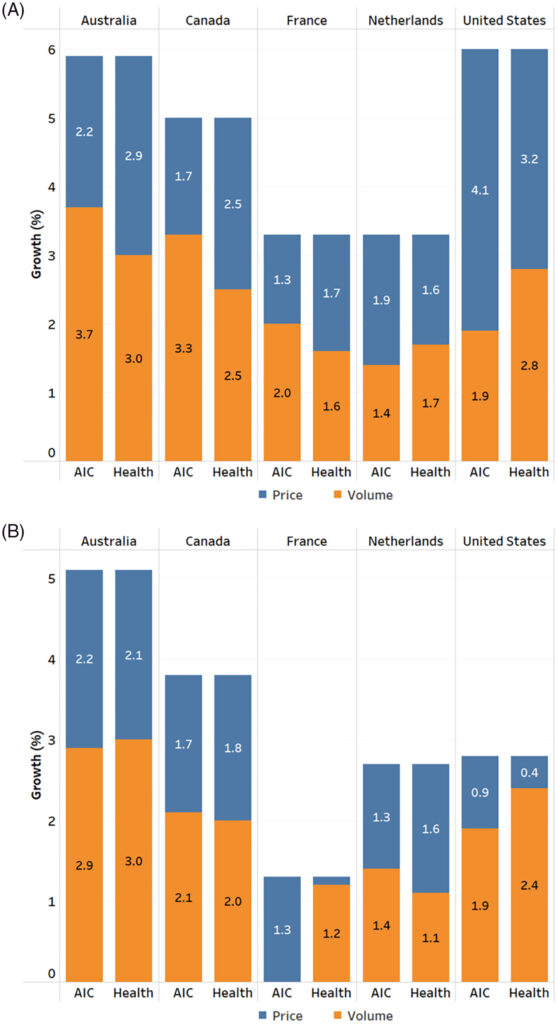
In the Figure below, spending growth is decomposed into prices and volume, where Panel A looks at consumption deflators for public payers and panel B looks at consumption deflators for private payers. One can clearly see that price growth was faster for health care purchased by public payers compared to those purchased by households (i.e., out-of-pocket costs or private insurance).
The full paper can be read here.