Here are a few highlight’s from the March 2021 report on Medicare Payment Policy from the Medicare Payment Advisory Commission (MedPAC).
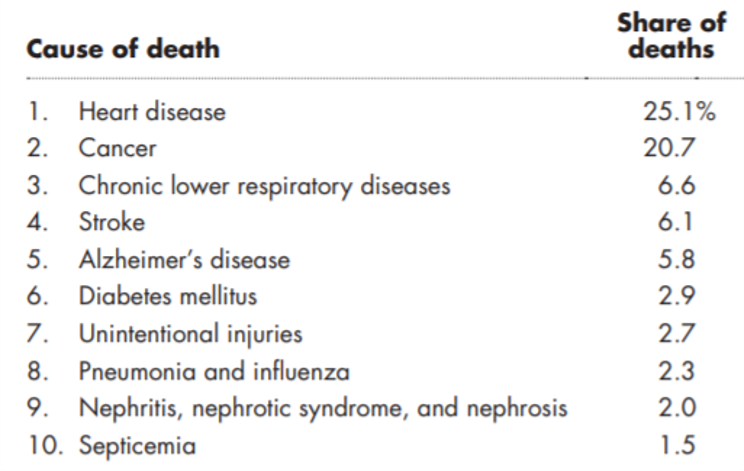
Leading causes of death
The leading cause of death are heart disease, cancer, and respiratory disease. Note that these figures are from 2018. MedPAC notes that the 3rd leading cause of death in 2020 was COVID-19.
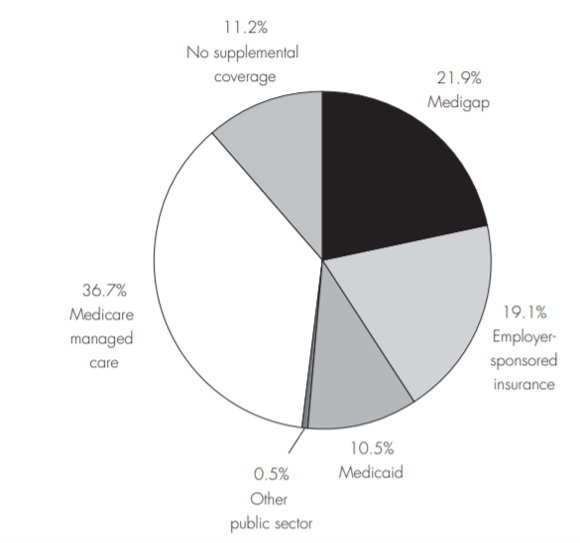
Coverage (Supplemental and Part D)
Also, most individuals with Medicare have additional coverage for cost sharing either by enrolling in a Medicare Supplemental Plan, coverage from their employer, or being included in a Medicare Advantage plan with less cost sharing.
Medicare beneficiaries receive drug coverage through Medicare Medicare Part D (with the exception of physician-administered drugs which are covered by Medicare Part B. Medicare Part D’s popularity has grown over time. In 2007, only 54% of Medicare beneficiaries were enrolled in Medicare Part D, but by 2020 that figure had increased to 75%.
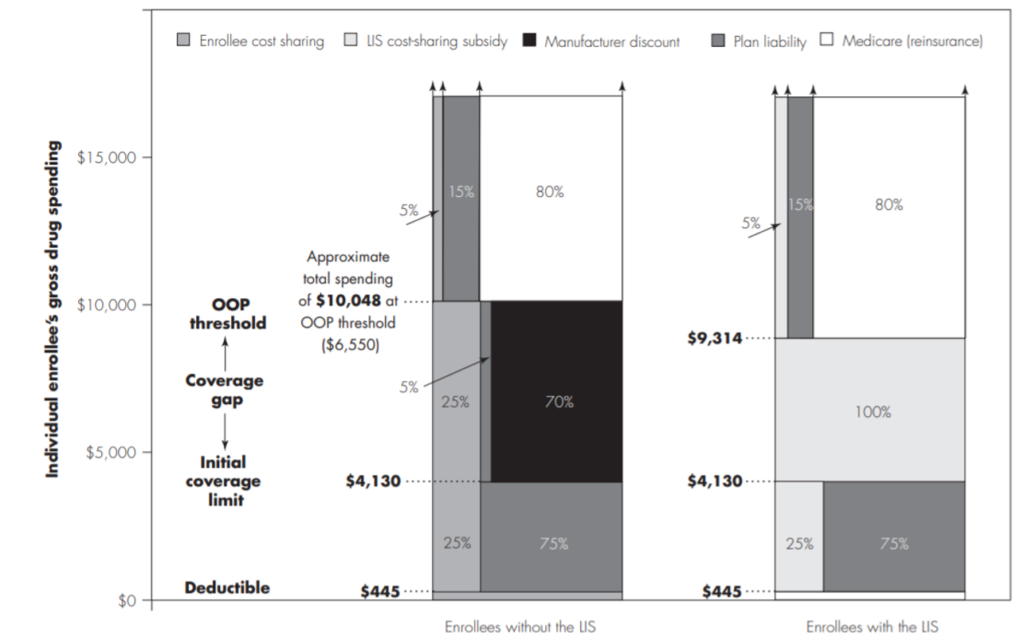
Part D benefit structure
Medicare Part D has a confusing benefit structure. It starts off with a deductible, then Part D plans pay for 75% of drugs while enrollees (for regular Part D plans) or Medicare (for enrollees in the low-income subsidy phase) pay the remaining 25%. Next comes the coverage gap or donut hole. Here, plans pay 5%, enrollees 25% and manufacturers pay 70% through discounted drug prices; in the LIS case, Medicare pays for everything. Once the out-of-pocket maximum is reached, enrollees only pay 5% of additional drug costs, plans pay 15% and Medicare pays 80%. MedPAC has a nice figure showing this benefit design graphically.
Note, however, that this standard benefit design is not actually used frequently in practice.
In practice, the defined standard benefit is used primarily to set the average value of basic benefits that plan sponsors must offer under alternative benefit designs. Most sponsors structure their basic benefits in ways that differ from the defined standard benefit, such as setting the deductible lower than $445 or using tiered copayments rather than coinsurance. Some plans also encourage use of lower cost medicines by not applying a deductible when a prescription is filled with certain preferred generics.
Drug prices
Overall, on the drug price front, we see two competing trends. On the one hand, some new branded drugs are becoming increasingly expensive (at gross drug prices prior to rebates). This means that Medicare is bearing more drug cost since these high cost drugs move people quickly to the catastrophic coverage zone.
We estimate that between 2007 and 2017, among enrollees without the LIS, the share of aggregate basic benefit costs for which plan sponsors were responsible declined from 53 percent to 29 percent (Medicare Payment Advisory Commission 2020c). For LIS enrollees, plan liability decreased from 30 percent to 19 percent .
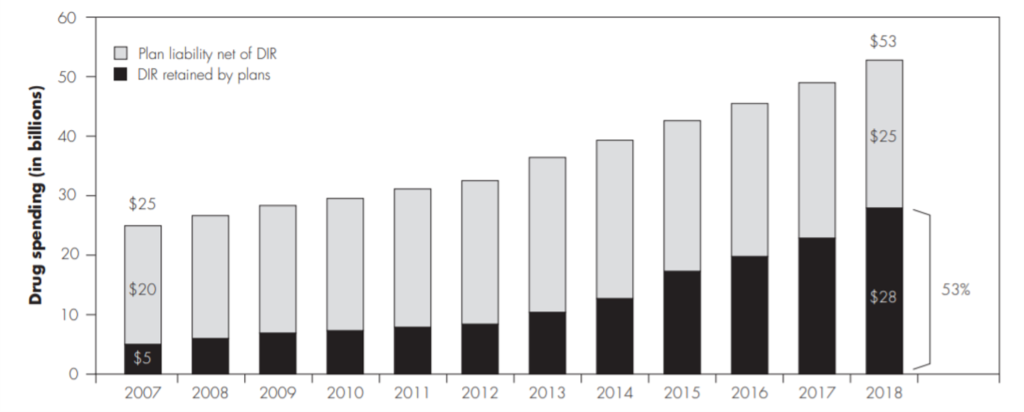
On the other hand, rebates are increasing and there is increased use of generic drugs. In 2007, rebates and discounts offset only about 20% of Part D plan liability; by 2018, now more than half (53%) of plan liability is offset through drug rebates and discounts.
Further, generic utilization is rising. The MedPAC report states that “nearly 90% of the prescriptions filled” are for generic drugs.
Taking into account both trends, MedPAC estimated that drug prices for Medicare Part D beneficiaries actually declined between 2018 and 2019 by 2.1%.
The MedPAC report has lots more interesting statistics and findings and (although it comes in at a whopping 500 pages) it has lots of interesting findings.