Budget impact models aim to let payers know how much a new drug will cost them. Clearly, payer cost depends on the dose. Some drugs are dosed the same for everyone. Other drugs are dosed based on patient weight, body surface area (BSA) or other criteria. If you’re a building a budget impact model, how should you calculate the dose.
Consider the example below where the drug’s dose depends on the patient’s weight. In this example, consider the case where an extra vial of the drug is needed for every 20 pounds of patient weight. Researchers are faced with two main questions: (i) from what population should the weight distribution be drawn and (ii) how should the cost of the drug for the “typical” patient be calculated.
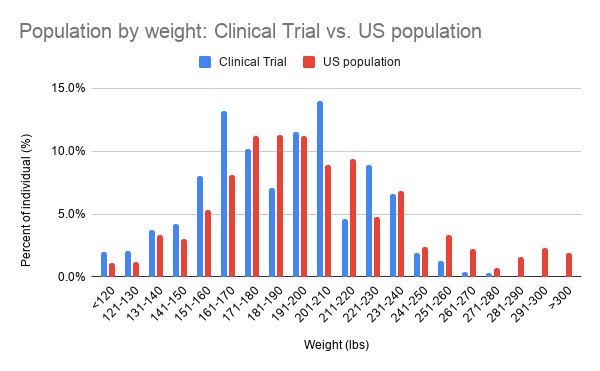
Regarding the first question, the natural choice at first may seem to be look at the data from the clinical trial. From a payers perspective, however, the typical dose isn’t the clinical trial population, but rather the dose that can be expected of their population. In this example, we can see that patients in the clinical trial had lower weight than those in the U.S. population as a whole (red bars taken from CDC weight data for 50-59 year old males). Because clinical trials typically have a smaller sample size, one would expect that the U.S. population would better reflect the weight distribution the payer can expect. This is not true in all cases. For some diseases, patients may be systematically over- or under-weight. If this is the case, data from the clinical trial could be better. An ideal case would be real-world weight data for the particular disease of interest, but that is not always available.
- Takeaway #1: Use real world data to estimate dosing for budget impact model unless there is a compelling reason why the clinical trial population better reflects payers’ expected dosing.
Now the question comes, how do we summarize the number of doses. One approach would be to estimate the number of doses for the typical patient. In my numerical example (you can view here), the dose for the mean patient using the U.S. population weight distribution is 10 doses (median weight = 190.1 lbs). However, payers don’t care how much they pay for the typical patient but how much they pay overall. In this case, one could use the mean weight which would indicate 11 doses (mean weight = 200.4 lbs). In my simple example, using the mean vs. median weight increased cost by 10%.
A preferred alternative, however, would be to use the full distribution of patients weight. Because the dosing schedule is non-linear (i.e., the number of vials increase only at 20 pound increments), the mean value may not reflect actual expected dosing. When using the full distribution of individuals, the expected number of doses is 10.49, approximately equidistant between mean and median doses. Note that if portions of a vial could be reused, the mean and distribution values would be equivalent. However, when there is wastage, one must count partial vials used as full vials.
- Takeaway #2. When dosing schedules are non-linear, estimate typical dosing based on the full patient distribution whenever possible
In many cases, you may not have access to individual patient data. In other cases–particularly if clinical trial data are used–the distribution may be very irregular. In my example, the U.S. population data looks much more normally distributed than does the clinical trial data. In either of these cases, one may want to try to fit the data with a parametric distribution. One approach for doing this would be to use the method of moments approach.
Regardless, best practice always is to make sure budget impact drug dosing best reflects that actual dosing payers should expect in their population to the greatest extent possible.
1 Comment